Industrial LED upgrades can reduce electricity use, maintenance visits, and lighting-related downtime. Yet returns differ widely between facilities. Operating hours, utility rates, existing fixtures, ceiling height, and installation costs all shape the outcome. A warehouse running lights through multiple shifts may see a different payback from a lightly used workshop. Details matter.
What is the average ROI for industrial LED lighting upgrades? There is no dependable single figure for every site. A useful estimate starts with actual utility bills, fixture counts, wattages, and annual operating hours. It also accounts for labor, controls, disposal, and any required electrical work. Small omissions can distort the result.
This guide explains how to build a transparent ROI estimate and compare it with measured performance after installation. It distinguishes simple payback from longer-term return, since they answer different questions. For a practical example, consider replacing older high-bay fixtures across a 100,000-square-foot warehouse. The calculation should show its assumptions, not hide them. Results are only as reliable as the inputs.
LEDs can deliver meaningful savings, but claims based on ideal conditions may not match a real facility. Verify product specifications, confirm the existing system’s energy use, and review the proposed layout before approving a project. Then track energy consumption and maintenance over time. That check may reveal overlooked costs—or savings the initial estimate missed.
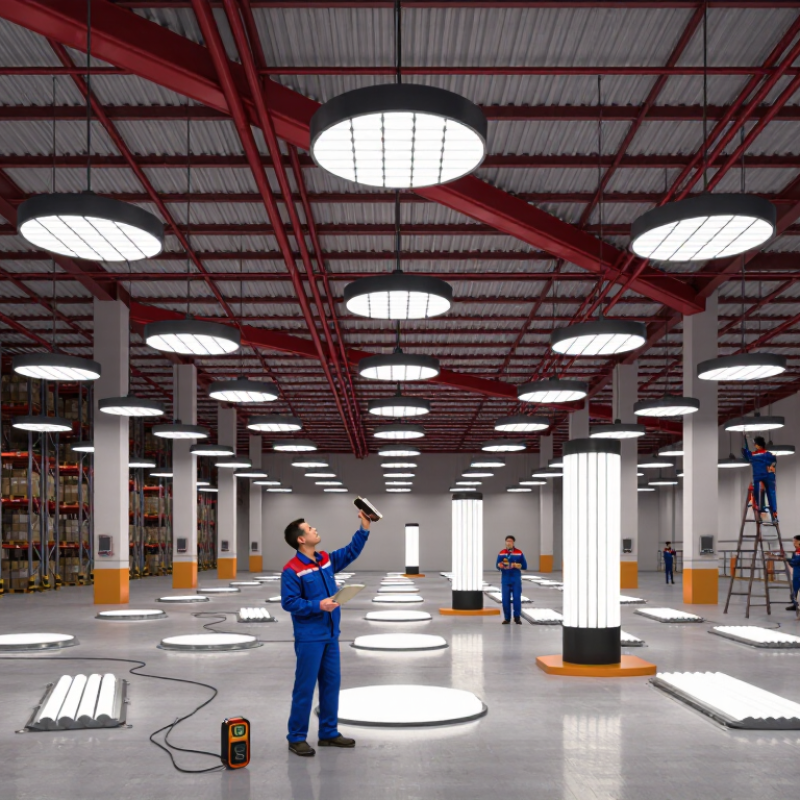
Define the Scope and Time Period for ROI Analysis
Before calculating average ROI for an industrial LED upgrade, define exactly what the project includes. Count the fixtures being replaced, installation labor, controls, wiring changes, and any disposal costs. Keep the boundary tight. If one production area is upgraded, do not mix its results with unrelated lighting work elsewhere in the facility.
Choose a time period that reflects actual operating conditions. A 12-month baseline can capture seasonal daylight, production shifts, and changes in operating hours. Compare it with a similar period after installation, using utility bills or lighting-system data where available. Include energy savings and measurable maintenance savings, such as fewer lift rentals or replacement lamps.
Subtract the project cost, then divide the net savings by that cost to express ROI as a percentage. That matters.
A short measurement window may exaggerate savings if production was unusually low, while a busy year can make results look stronger. Record electricity rates and operating hours, too; both can change.
Estimates are useful, but they are not proof. If schedules or production levels shifted, note the difference and adjust cautiously rather than presenting a precise figure as certain.
Collect Baseline Lighting Energy and Maintenance Costs
A credible ROI calculation starts with a measured baseline, not a fixture estimate. Record each lighting circuit’s input watts, operating hours, and utility tariff. Include production schedules, night shifts, and seasonal changes; a warehouse aisle lit continuously is not comparable to a loading bay used intermittently. The U.S. Department of Energy’s Building Energy Data Book reports that lighting represented about 17% of U.S. commercial-building electricity use in 2012. That figure is useful context, not a substitute for plant-specific measurements.
Build a maintenance baseline from invoices and work orders over at least 12 months. Capture lamp and ballast purchases, technician hours, lift rentals, disposal costs, and outages that interrupt work. The DOE’s 2017 Energy Savings Forecast of Solid-State Lighting in General Illumination Applications evaluates savings against existing lighting baselines, reinforcing a practical point: the comparison depends on what is actually installed today. Keep records by fixture type and area. One imperfect detail matters: old work orders may omit time spent finding a failed lamp. Note that uncertainty rather than treating missing labor as zero. A handheld meter can spot-check circuit load, while utility bills help verify the total. Keep copies of both.
Estimate Upgrade Costs and Expected Annual Savings
To estimate an industrial LED upgrade, begin with a fixture count and a site walk. Record each fixture’s input wattage, operating hours, control type, and mounting height. Then compare these figures with supplier specifications and itemized installation quotes. Include fixtures, controls, lifts, wiring, disposal, and any production downtime. Costs can vary sharply. A high-bay warehouse retrofit is not priced like a clean, low-ceiling workshop.
For a practical savings estimate, subtract the new fixture wattage from the old, multiply by fixture count and annual hours, then divide by 1,000. For example, replacing 100 fixtures drawing 150 watts with 60-watt LEDs, at 4,000 hours yearly, saves about 36,000 kWh. At roughly 8.3 cents per kWh, close to the 2023 U.S. industrial average reported by the Energy Information Administration, that is about $3,000 in annual energy savings. Check your actual tariff; demand charges and utility rates change the result. The U.S. Department of Energy’s solid-state lighting research also treats operating hours and system performance as important savings drivers. A spreadsheet can look precise. It often is not: occupancy sensors, dirt, failed lamps, and uneven schedules complicate the estimate. Keep energy savings separate from maintenance savings, and use measured runtime where possible.
How to Find the Average ROI of Industrial LED Upgrades — Estimate Upgrade Costs and Expected Annual Savings
| Facility Example |
Fixture Count |
Existing to LED
System Wattage |
Annual Operating Hours |
Electricity Rate |
Annual Energy Savings |
Estimated Installed Cost |
Annual Energy Cost Savings |
Estimated Annual Maintenance Savings |
Total Annual Savings |
Simple Payback |
Annual ROI |
| Small warehouse |
80 |
250 W to 100 W |
3,000 |
$0.11/kWh |
36,000 kWh |
$14,400 |
$3,960 |
$800 |
$4,760 |
3.03 years |
33.1% |
| Manufacturing facility |
200 |
400 W to 150 W |
5,000 |
$0.13/kWh |
250,000 kWh |
$70,000 |
$32,500 |
$6,000 |
$38,500 |
1.82 years |
55.0% |
| Distribution center |
300 |
250 W to 100 W |
6,000 |
$0.10/kWh |
270,000 kWh |
$45,000 |
$27,000 |
$9,000 |
$36,000 |
1.25 years |
80.0% |
Illustrative estimates for comparison, not project quotations. Energy savings are calculated as fixture count × wattage reduction × annual operating hours ÷ 1,000. Annual ROI = total annual savings ÷ installed cost × 100; simple payback = installed cost ÷ total annual savings. Estimates exclude rebates, financing, taxes, demand-charge changes, and future utility-rate increases.
Calculate ROI for Each Industrial LED Upgrade
Calculate ROI for each industrial LED upgrade separately, not as one plant-wide estimate. Record fixture count, existing wattage, proposed wattage, annual operating hours, and the electricity rate. For example, replacing 120 fixtures that each use 150 fewer watts, running 4,000 hours yearly at $0.12 per kWh, saves about $8,640 in annual energy costs. Small detail. Confirm actual hours from operating schedules; a dusty warehouse may not run as consistently as the maintenance log suggests.
Add expected maintenance savings, then compare annual benefits with the full installed cost, including labor, lifts, controls, and disposal. If the project costs $30,000 and saves $8,640 in energy plus an estimated $1,800 in maintenance, simple payback is about 2.9 years. Annual ROI before financing is roughly 34.8%, calculated as $10,440 divided by $30,000. Treat maintenance savings as an estimate, not a certainty.
The U.S. Department of Energy’s LED lighting guidance reports that LEDs use at least 75% less energy and last up to 25 times longer than incandescent lighting. That is a broad benchmark, not a guaranteed saving against industrial HID or fluorescent fixtures. Use measured baseline data and utility bills for each area. Check demand charges and lighting controls separately; both can change the result. In practice, assumptions will be imperfect. Note them.
Compare Results and Account for Key Variables
How to Find the Average ROI of Industrial LED Upgrades
Compare Results and Account for Key Variables
A fair comparison starts with a clear baseline. Record each area’s lighting load, operating hours, and energy use before installation. After the upgrade, compare similar production periods, not just calendar months. A night-shift warehouse and a daytime workshop will rarely show matching savings. Real sites are rarely tidy.
Calculate each site’s annual net savings, then divide by its installed project cost. Include energy savings, reduced lamp and maintenance costs, and any added controls or service expenses. Keep the measurement period consistent. A simple average treats every site equally; a weighted average gives larger projects more influence. State which method you use.
Several variables can change the result. Production schedules, electricity rates, dimming settings, fixture placement, and required light levels all matter. Check work surfaces with a light meter, since lower energy use is not useful if task areas become too dim. Account for installation downtime, too. Utility bills may also include demand charges, which can shift the estimate. Some figures will be imperfect; note assumptions rather than hiding them. Then compare results across sites with similar hours and operating conditions.
How to Find the Average ROI of Industrial LED Upgrades
Compare estimated first-year returns across facility types and account for operating hours, energy costs, maintenance savings, and installed project cost.
Illustrative average: 55.6% first-year ROI. ROI is calculated as (annual energy-cost savings + annual maintenance savings) ÷ installed project cost. The modeled scenarios assume warehouse savings of $72,000 in energy and $8,000 in maintenance on a $150,000 project; manufacturing savings of $131,400 and $12,000 on $240,000; parking-garage savings of $43,800 and $6,000 on $90,000; and cold-storage savings of $87,600 and $10,000 on $180,000. These estimates are examples, not measured results; actual ROI varies with operating hours, electricity rates, fixture counts, maintenance needs, and incentives.
FAQS
Count replacement fixtures, labor, controls, wiring changes, and disposal costs. Keep the project boundary specific.
Compare a 12-month baseline with a similar period after installation. This helps account for daylight, shifts, and changing operating hours. Short windows can mislead.
Add measurable energy and maintenance savings, subtract added costs, then divide by project cost. Multiply by 100 for a percentage.
Include documented reductions, such as fewer replacement lamps or lift rentals. Estimates can help, but they are not proof.
A simple average treats every site equally. A weighted average gives larger projects more influence. State which method you use.
A night-shift warehouse and a daytime workshop have different operating patterns. Compare sites with similar hours and conditions where possible.
Production schedules, electricity rates, dimming settings, fixture placement, and light levels can all affect savings. Record operating hours, too.
Use a light meter on work surfaces after installation. Lower energy use is not useful if task areas become too dim.
Note assumptions, downtime, and changes in production. Some figures will remain imperfect. That deserves a second look.
Conclusion
Finding the average ROI of industrial LED upgrades starts with setting a clear scope and analysis period, such as evaluating one facility over several years. Establish a reliable baseline by documenting current lighting energy use, electricity costs, and maintenance expenses, including lamp replacement and labor. Then estimate the full upgrade cost, covering equipment, installation, and any related work, and project annual savings from reduced energy consumption and maintenance needs.
Calculate ROI consistently for each upgrade by comparing its expected financial benefits with its costs over the chosen period. Consider payback time as well as total returns, and compare results across areas or facilities using the same assumptions. What is the average ROI for industrial LED lighting upgrades? There is no single figure that applies to every project: results depend on operating hours, energy rates, existing system efficiency, installation costs, and maintenance needs. Testing these variables with conservative and optimistic estimates helps produce a more useful average and supports sound investment decisions.
 Suvlux Light